Messier 3: Changing Starlight Helps Measure Distance
The hazy cluster in Canes Venatici contains a large population of stars that change brightness. Measurements across their cycles make those variations useful for studying stellar behaviour and the cluster’s distance.

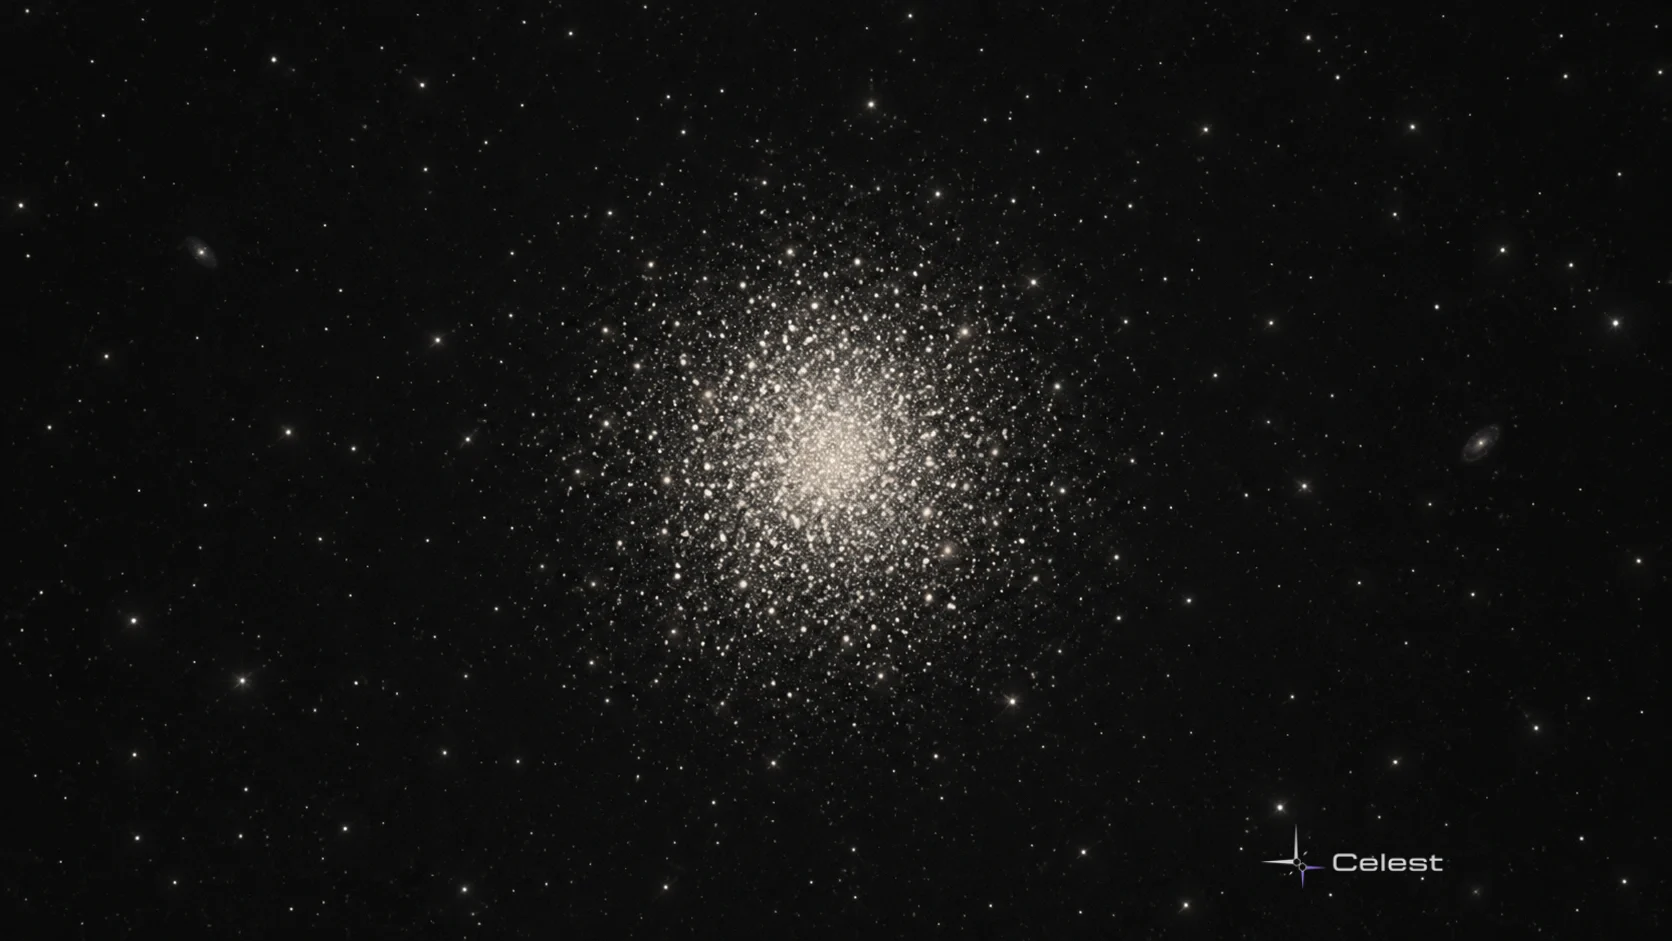
Messier 3, also called M3 or NGC 5272, is a globular cluster in Canes Venatici. Its large, compact population includes many stars whose brightness changes with time. Begin with the constellation guide to identify its part of the sky before examining the cluster’s faint overall glow.
NASA’s overview places it roughly 34,000 light-years away. Its variable stars provide more than visual interest: repeated measurements can help researchers estimate distance. A familiar observing target therefore connects with one of astronomy’s practical questions, how far away the objects we see really are.
M3 at a Glance
- Type: an ancient globular star cluster.
- Constellation: Canes Venatici.
- Distance: approximately 34,000 light-years in NASA’s overview.
- Population: more than 500,000 stars.
- Apparent magnitude: about 6.2.
- Discovery: Charles Messier observed it in 1764.
Explore individual stars when comparing brightness and colour. M3’s magnitude combines the light of an enormous group, while the properties of one selected variable belong to a particular member. Keeping those scales separate helps make sense of both an observing view and a research result.
How Can You Begin Observing M3?
Use the live sky to locate Canes Venatici on your chosen date. NASA highlights June as a favourable observing period. Binoculars can reveal the cluster, and a telescope can show more of its rounded structure and, under suitable conditions, individual members.
A darker evening with less moonlight helps when studying the surrounding faint glow. First compare the brighter central region with the outer parts. A good first observation is recognising the cluster’s structure, before trying to follow a particular star’s changing light.
M3’s variables are individual objects within a crowded field. Measuring one requires repeated observations and a way to distinguish its contribution from nearby stars. Finding the cluster is a useful starting point for understanding where those measurements take place.
What Kind of Stellar Group Is It?
A globular cluster is a compact, roughly spherical population held together by gravity. Such systems can survive for billions of years. Their old stars help researchers investigate stellar evolution within large groups that have a long shared history.
Charles Messier initially treated M3 as a nebulous object when he discovered it in 1764. William Herschel later distinguished its individual stars in 1784. The transition from a diffuse patch to a resolved population changed the questions observers could ask about the same object.
What Does a Variable Star Do?
Its brightness changes over time. A 2019 Hubble overview reported 274 known variable stars in M3, including at least 170 RR Lyrae stars. That is a dated account of the known population, rather than a complete list that stops changing as observations improve.
RR Lyrae stars pulsate: their surfaces expand and contract through repeating cycles. These are generally short-period changes, commonly taking less than a day for this class. Individual members differ in their cycles, and the group’s variable population includes more than one stellar type.
How Is a Light Cycle Measured?
Researchers record brightness at many times and build a light curve, a record of how the signal changes. The repeating pattern supplies a period, the time required for one cycle. Measurements through different observing bands help test whether the inferred period is consistent.
The Gaia processing documentation illustrates how carefully these records are checked. It includes period analysis, light and velocity measurements, classification and checks across three photometric bands. A cycle becomes scientifically useful when the observations identify and characterise it reliably.
Those checks also preserve differences between types of pulsation. A single photograph captures one stage, while a sequence reveals how that star behaves. Information about time adds another dimension to the familiar picture of a crowded cluster.
How Can Changing Light Help Measure Distance?
Some types of variable star have properties that allow their intrinsic brightness to be calibrated. Researchers compare that estimate of how much light the star produces with how bright it appears from Earth. This comparison provides a route to estimating distance.
RR Lyrae stars are often described as standard candles: sources with an established brightness scale. The star’s classification, measured cycle and calibration matter; a period alone does not supply every ingredient needed for a reliable result.
What Did a Study Published in 2026 Find?
The investigation applied an infrared surface-brightness method to 14 RR Lyrae stars in M3. It combined optical and near-infrared brightness measurements with velocity curves and an empirical calibration. The analysis estimated the stars’ distances and mean radii.
The reported average distance was about 33,000 light-years, with uncertainties. That is close to the rounded value used in general observing descriptions, while supplying a specific measured result. Fourteen describes the selected research sample, rather than the total number of variable stars in the cluster.
The method also let researchers compare fitting choices and different calibrated relations. Such work tests how well an approach performs on a distant stellar group. Its value includes both an estimate of the cluster’s distance and an assessment of the measurements used to obtain it.
Why Study More Than the Cluster’s Appearance?
M3 offers many changing stars within one physical system. Researchers can compare their cycles, test ways of measuring distance and investigate how the members evolve. The old stellar group becomes a setting in which observations and methods can be checked together.
When you find its soft glow, you have located the combined light of more than half a million stars. Within that glow, individual changes contain useful information. The cluster’s story moves from recognising a shape to reading a rhythm, and from that rhythm to testing the scale of the galaxy.
Leave a comment
Comments appear after moderation.